debug调试工具 - 模具行业软件开发——模具行业从业者必备知识手册
-
<h2>debug</h2>
<p><a href="https://opencollective.com/debug/backers/badge.svg"><img src="#backers" alt="OpenCollective</a>"></p>
<p><a href="https://opencollective.com/debug/sponsors/badge.svg"><img src="#sponsors" alt="OpenCollective</a>"></p><p><img width="647" src="upload://jxcIoeE8SCJlC0o7FjUO216nhfU.png"></p>
<p>A tiny JavaScript debugging utility modelled after Node.js core's debugging</p>
<p>technique. Works in Node.js and web browsers.</p><h3>Installation</h3>
<pre><code>
$ npm install debug
</code></pre><h3>Usage</h3>
<p><code>debug</code> exposes a function; simply pass this function the name of your module, and it will return a decorated version of <code>console.error</code> for you to pass debug statements to. This will allow you to toggle the debug output for different parts of your module as well as the module as a whole.</p>
<p>Example <a href="./examples/node/app.js">app.js</a>:</p>
<pre><code>
var debug = require('debug')('http')
, http = require('http')
, name = 'My App';// fake app
debug('booting %o', name);
http.createServer(function(req, res){
debug(req.method + ' ' + req.url);
res.end('hello\n');
}).listen(3000, function(){
debug('listening');
});// fake worker of some kind
require('./worker');
</code></pre><p>Example <a href="./examples/node/worker.js">worker.js</a>:</p>
<pre><code>
var a = require('debug')('worker:a')
, b = require('debug')('worker:b');function work() {
a('doing lots of uninteresting work');
setTimeout(work, Math.random() * 1000);
}work();
function workb() {
b('doing some work');
setTimeout(workb, Math.random() * 2000);
}workb();
</code></pre><p>The <code>DEBUG</code> environment variable is then used to enable these based on space or</p>
<p>comma-delimited names.</p><p>Here are some examples:</p>
<p><img width="647" alt="screen shot 2017-08-08 at 12 53 04 pm" src="upload://tvIUaxznwuvUO4QIFupYGC6yaJ5.png"></p>
<p><img width="647" alt="screen shot 2017-08-08 at 12 53 38 pm" src="upload://zMim3590sKLQOmTPFa3Msabl6Ur.png"></p>
<p><img width="647" alt="screen shot 2017-08-08 at 12 53 25 pm" src="upload://w0Ihmy0jOMlD7xh6T158BS4l9PS.png"></p><p>#### Windows command prompt notes</p>
<p>##### CMD</p>
<p>On Windows the environment variable is set using the <code>set</code> command.</p>
<pre><code>
set DEBUG=*,-not_this
</code></pre><p>Example:</p>
<pre><code>
set DEBUG=* & node app.js
</code></pre><p>##### PowerShell (VS Code default)</p>
<p>PowerShell uses different syntax to set environment variables.</p>
<pre><code>
$env:DEBUG = "*,-not_this"
</code></pre><p>Example:</p>
<pre><code>
$env:DEBUG='app';node app.js
</code></pre><p>Then, run the program to be debugged as usual.</p>
<p>npm script example:</p>
<pre><code>
"windowsDebug": "@powershell -Command $env:DEBUG='*';node app.js",
</code></pre><h3>Namespace Colors</h3>
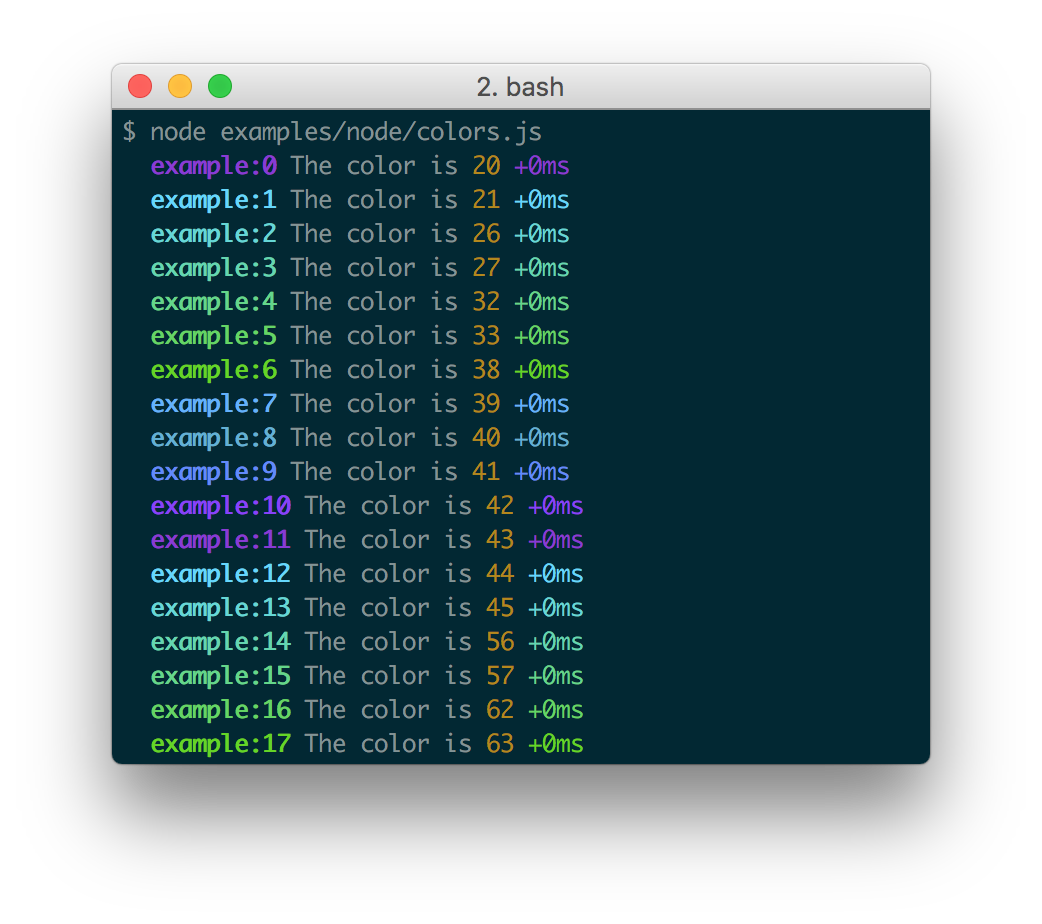
<p>Every debug instance has a color generated for it based on its namespace name.</p>
<p>This helps when visually parsing the debug output to identify which debug instance</p>
<p>a debug line belongs to.</p><p>#### Node.js</p>
<p>In Node.js, colors are enabled when stderr is a TTY. You also should install</p>
<p>the <a href="https://npmjs.org/supports-color"><code>supports-color</code></a> module alongside debug,</p>
<p>otherwise debug will only use a small handful of basic colors.</p><p><img width="521" src="https://user-images.githubusercontent.com/71256/29092181-47f6a9e6-7c3a-11e7-9a14-1928d8a711cd.png"></p>
<p>#### Web Browser</p>
<p>Colors are also enabled on "Web Inspectors" that understand the <code>%c</code> formatting</p>
<p>option. These are WebKit web inspectors, Firefox (since version</p>
<p>31)</p>
<p>and the Firebug plugin for Firefox (any version).</p><p><img width="524" src="upload://dQu6IqVLizb5lc4IAOLz2fRpFpS.png"></p>
<h3>Millisecond diff</h3>
<p>When actively developing an application it ca</p>
<hr>
<p>还有什么补充参数吗?一起完善。</p>